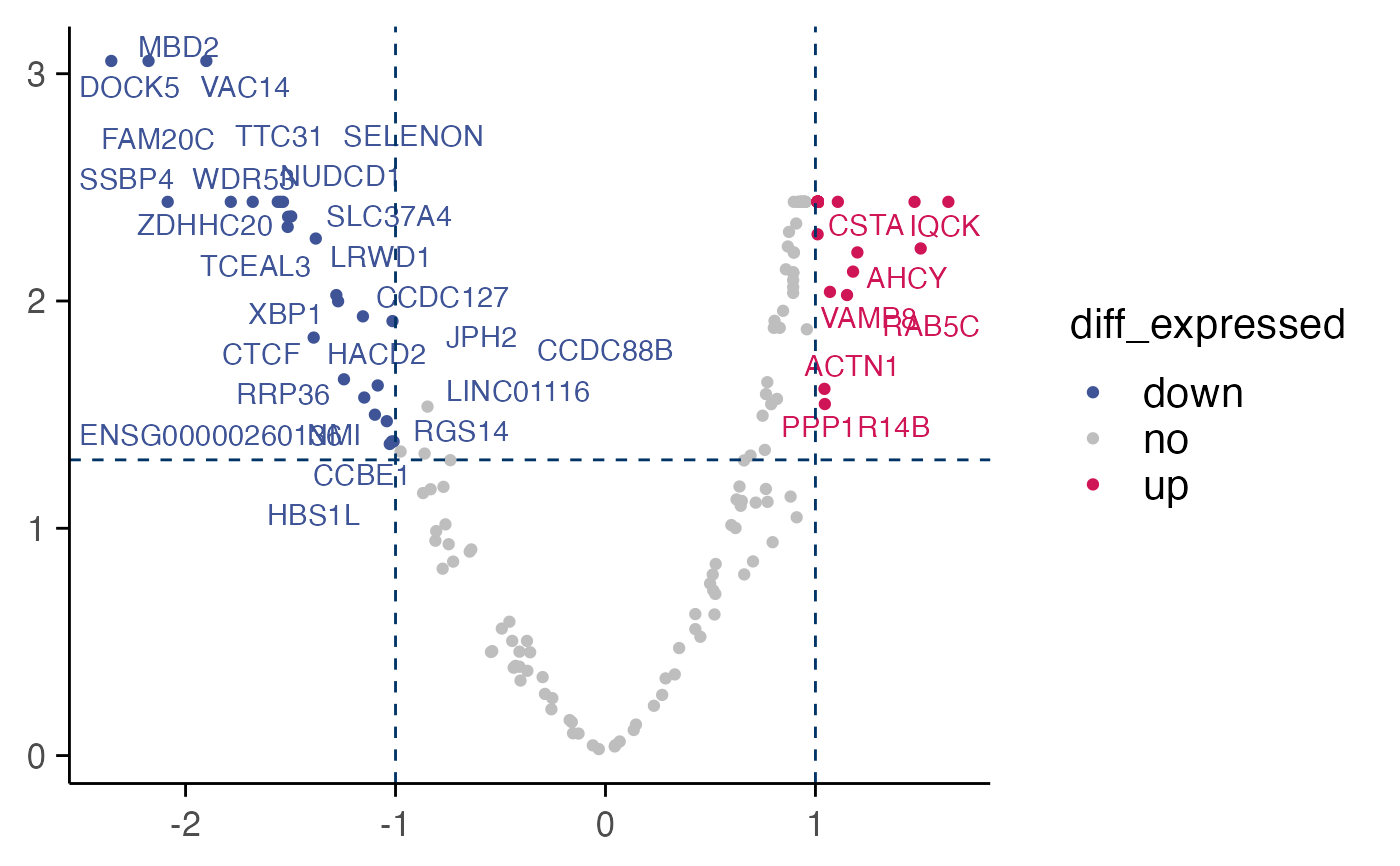
Volcano plot of differentially expressed genes
Usage
plot_volcano(
  top_table,
  x = "log2FC",
  y = "p_value_adj",
  fdr_cutoff = 0.05,
  max.overlaps = 30
)
Arguments
- top_table
Data frame with columns that contain FC and P-values, default to log2FC and p_value_adj
- x
Name of the column with logFC values
- y
Name of the column with adjusted p-values
- fdr_cutoff
Cutoff for labels to be plotted based on their adjusted p-values
- max.overlaps
Maximum number of overlaps of points for package ggrepel
Examples
data("mini_mac")
top_table <- mini_mac@tools$diff_exprs$Staurosporine_10
plot_volcano(top_table = top_table, max.overlaps = 100)
#> Warning: ggrepel: 353 unlabeled data points (too many overlaps). Consider increasing max.overlaps