Plot QC metrics such as standard deviation (sd), median absolute deviation (MAD), interquartile range (IQR), or Z score or read counts per condition/group of interest in a lollipop chart
Examples
data("mini_mac")
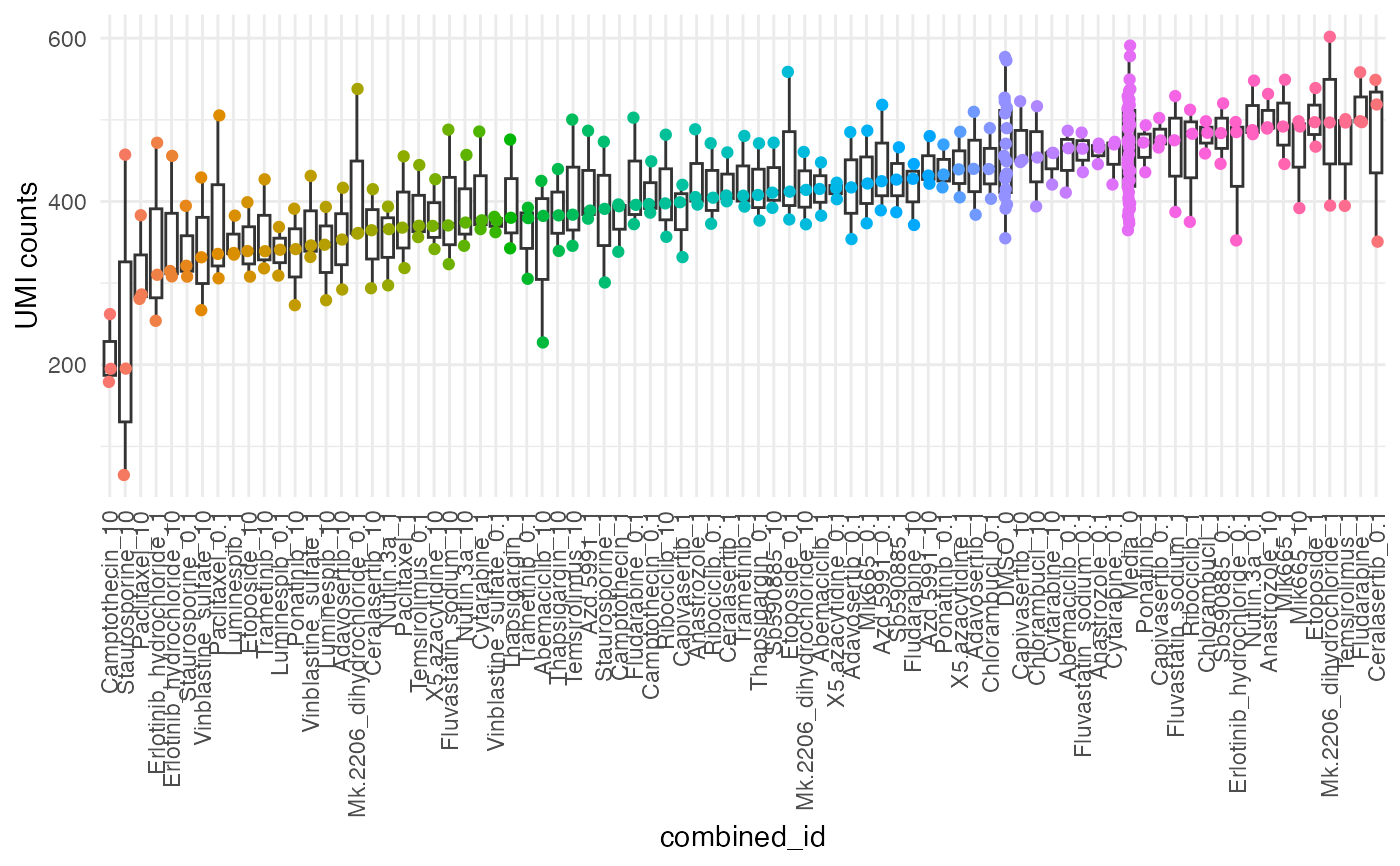
qc_stats <- compute_qc_metrics(mini_mac, group_by = "combined_id", order_by = "median")
plot_qc_metrics(qc_stats, group_by = "combined_id", metrics = "sd_value")