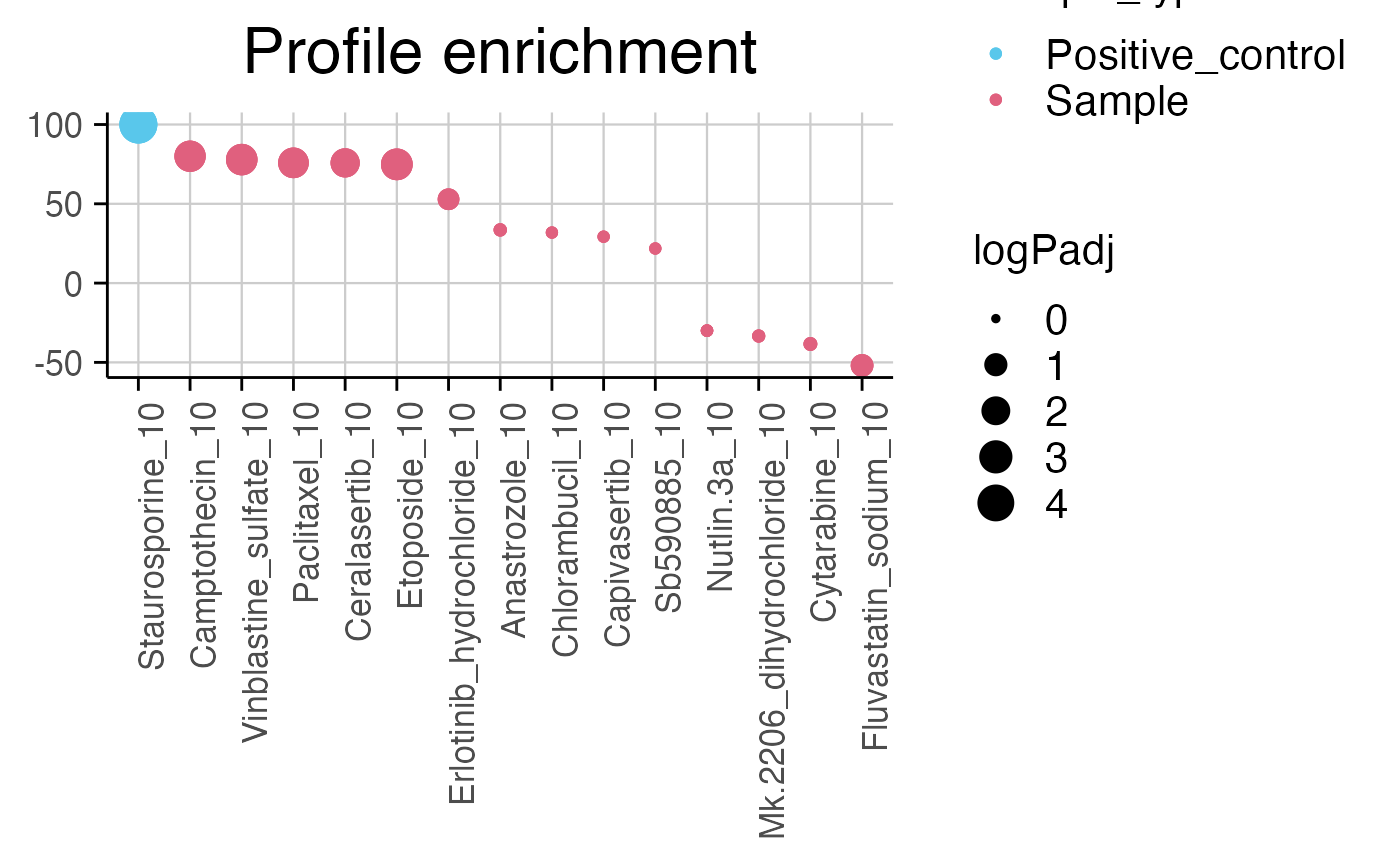
Plot multi-screen profile from fgsea results
Source:R/plot_multi_screen_profile.R
plot_multi_screen_profile.RdPlot multi-screen profile from fgsea results
Arguments
- data
A tidyseurat object with
screen_profilein the @tools slot.- color_by
A string specifying which column in screen_profile to use for color (default: automatically chosen).
- size_by
A string specifying which column in screen_profile to use for point size (default: log10(padj)).
- label_angle
Angle of x-axis labels (default: 90).
Examples
data(mini_mac)
mini_mac <- compute_multi_screen_profile(mini_mac, target = "Staurosporine_10")
plot_multi_screen_profile(mini_mac, color_by = "Sample_type")