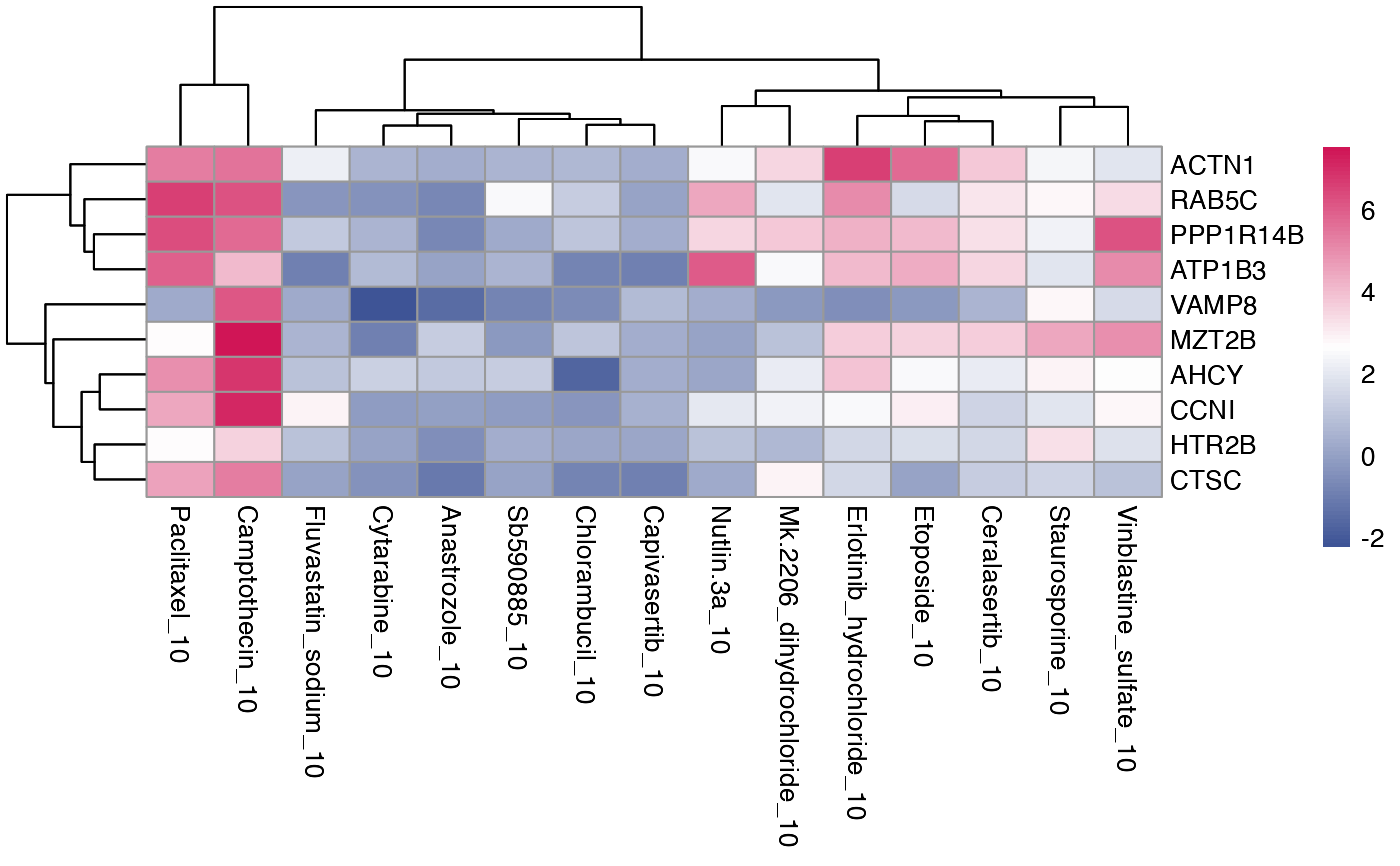
Generate heatmap of DE genes from multiple treatments This is the function to generate a heatmap of DE genes from running compute_multi_DE that shared by more than one treatment group. There are a few options available to help you to extract shared DE genes.
Source:R/plot_multi_de.R
plot_multi_de.RdGenerate heatmap of DE genes from multiple treatments This is the function to generate a heatmap of DE genes from running compute_multi_DE that shared by more than one treatment group. There are a few options available to help you to extract shared DE genes.
Usage
plot_multi_de(
  data = NULL,
  group_by = NULL,
  value = NULL,
  p_value_cutoff = 0.01,
  direction = "both",
  n_genes = 10,
  control = "DMSO_0",
  by = "fc",
  gene_list = NULL
)
Arguments
- data
A tidyseurat object merged with metadata. Must contain columns "Well_ID", "Row", "Column".
- group_by
A column that specifies the treatment group in the input data
- value
To use logCPM, log2FC or metric in the heatmap
- p_value_cutoff
Cutoff for adjusted p-value (column p_value_adj), default 0.01
- direction
Direction to select up or down regulated genes or in both directions
- n_genes
Top n genes to be extracted from each treatment comparison
- control
The control group to be included in the final heatmap, usually DMSO_0
- by
Extract top n genes by either absolute fold change or by adjusted p-value
- gene_list
External list of genes to plot the heatmap on
Examples
data("mini_mac")
plot_multi_de(mini_mac,group_by = "combined_id",
             value = "log2fC", p_value_cutoff = 0.01, direction="up",
             n_genes = 10, control = "DMSO_0", by="fc")