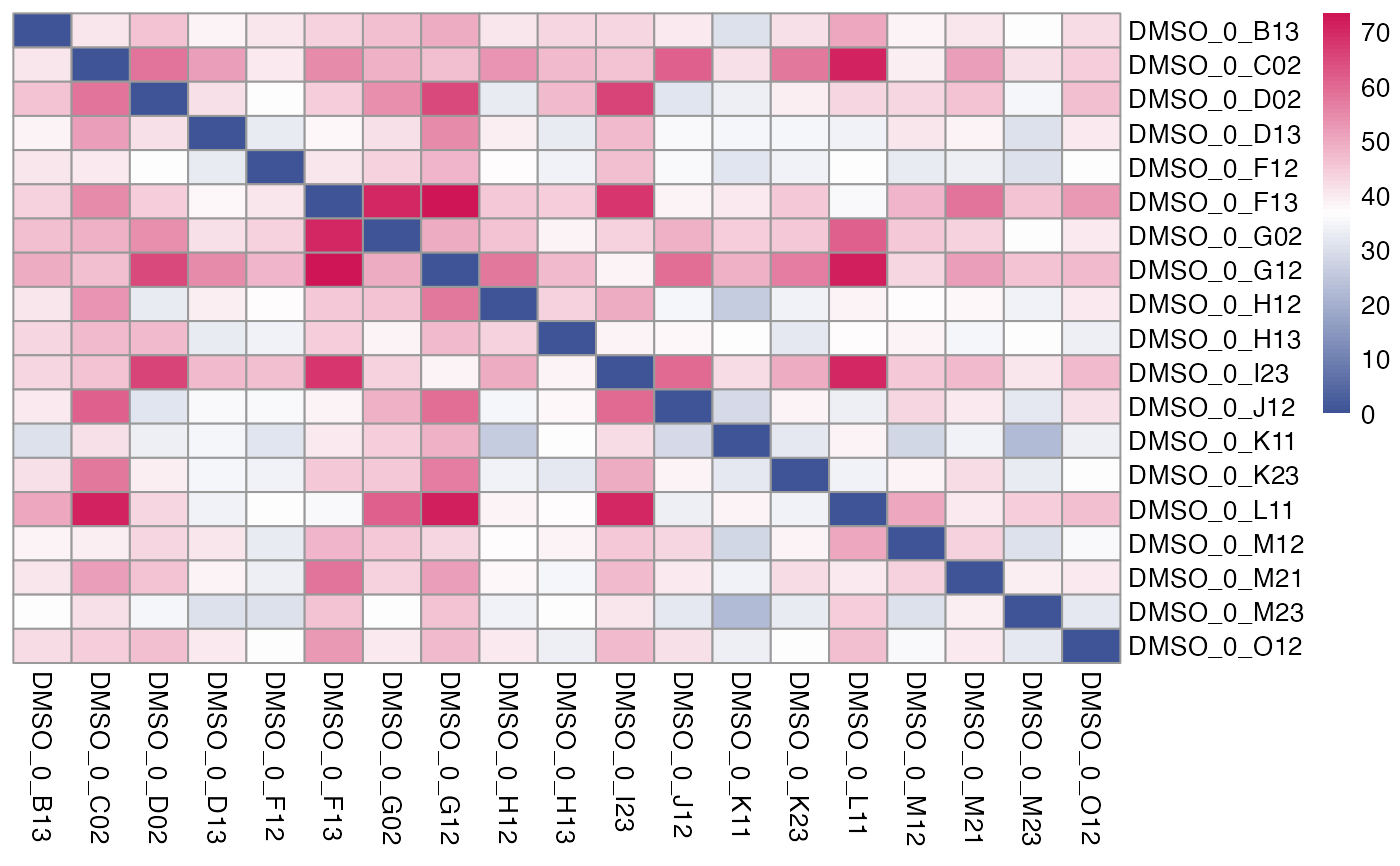
Plot a heatmap to show poisson distance on count matrix of pre-processed data. The poisson distance matrix is calculated on subset of wells that specify by two other parameters. By specifying group_by to a column in the metadata and a specific treatment of interest, poisson distance is then calculated for corresponding wells.
Examples
data(mini_mac)
p <- plot_distance(mini_mac, group_by = "combined_id", treatment = "DMSO_0")
#> tidyseurat says: A data frame is returned for independent data analysis.