Model Gene Dose-Response Curve Using drc
Source:R/compute_single_dose_response.R
compute_single_dose_response.RdModel Gene Dose-Response Curve Using drc
Usage
compute_single_dose_response(
  data,
  gene = NULL,
  pathway = NULL,
  normalisation = "limma_voom",
  treatment_value,
  control_value = "DMSO",
  batch = 1,
  k = 2
)
Arguments
- data
A Seurat or TidySeurat object containing expression and metadata.
- gene
A gene name (must match a row name in the object).
- pathway
A character string present in the list of enriched pathways.
- normalisation
One of "raw", "logNorm", "cpm", "clr", "SCT", "DESeq2", "edgeR", "RUVg", "RUVs", "RUVr", "limma_voom", "zinb". If empty, defaults to cpm
- treatment_value
A character string matching one value in metadata column "Treatment_1".
- control_value
A character string matching one value in metadata column "Treatment_1".
- batch
Either empty, a single value, or a vector corresponding to the number of samples
- k
Parameter k for RUVSeq methods, check RUVSeq tutorial
Examples
# \donttest{
data(mini_mac)
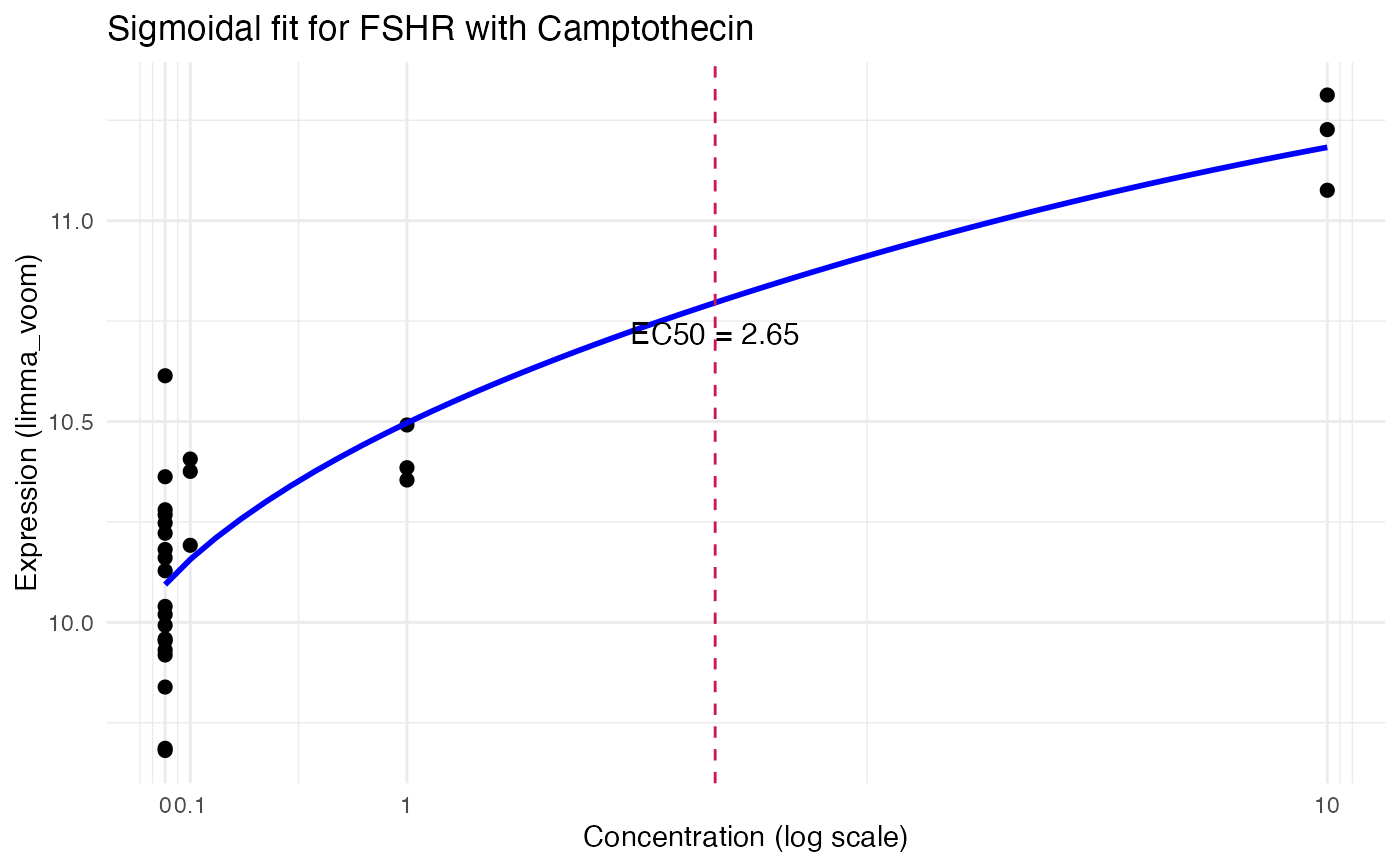
res <- compute_single_dose_response(data = mini_mac,
gene = "FSHR",
normalisation = "limma_voom",
treatment_value = "Camptothecin")
#>
#> Estimated effective doses
#>
#> Estimate Std. Error Lower Upper
#> e:1:50 2.6528 2.3796 -2.2585 7.5641
res$plot
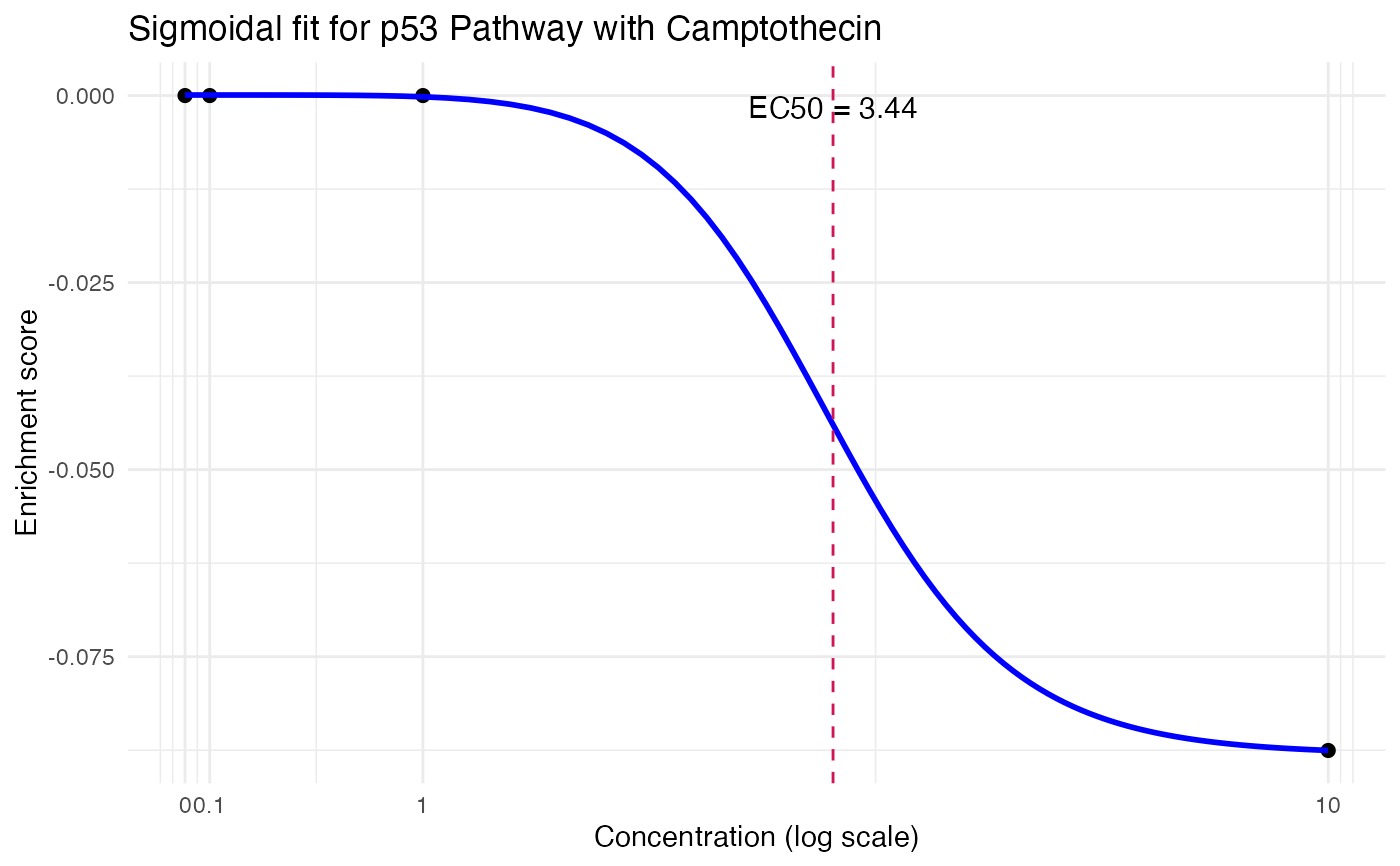
 res <- compute_single_dose_response(data = mini_mac,
pathway = "p53 Pathway",
treatment_value = "Camptothecin")
#> Warning: NaNs produced
#> Warning: NaNs produced
#> Warning: NaNs produced
#>
#> Estimated effective doses
#>
#> Estimate Std. Error Lower Upper
#> e:1:50 3.4395 10.0000 NaN NaN
res$plot
res <- compute_single_dose_response(data = mini_mac,
pathway = "p53 Pathway",
treatment_value = "Camptothecin")
#> Warning: NaNs produced
#> Warning: NaNs produced
#> Warning: NaNs produced
#>
#> Estimated effective doses
#>
#> Estimate Std. Error Lower Upper
#> e:1:50 3.4395 10.0000 NaN NaN
res$plot
 # }
# }